DE Arabia Map
This guide provides detailed instructions on how to use the different features of the Digital Earth Arabia Map.
Get Started
To launch the DE Arabia Map and display some basic data follow these steps.
Launch the DE Arabia Map at DE Arabia Map.
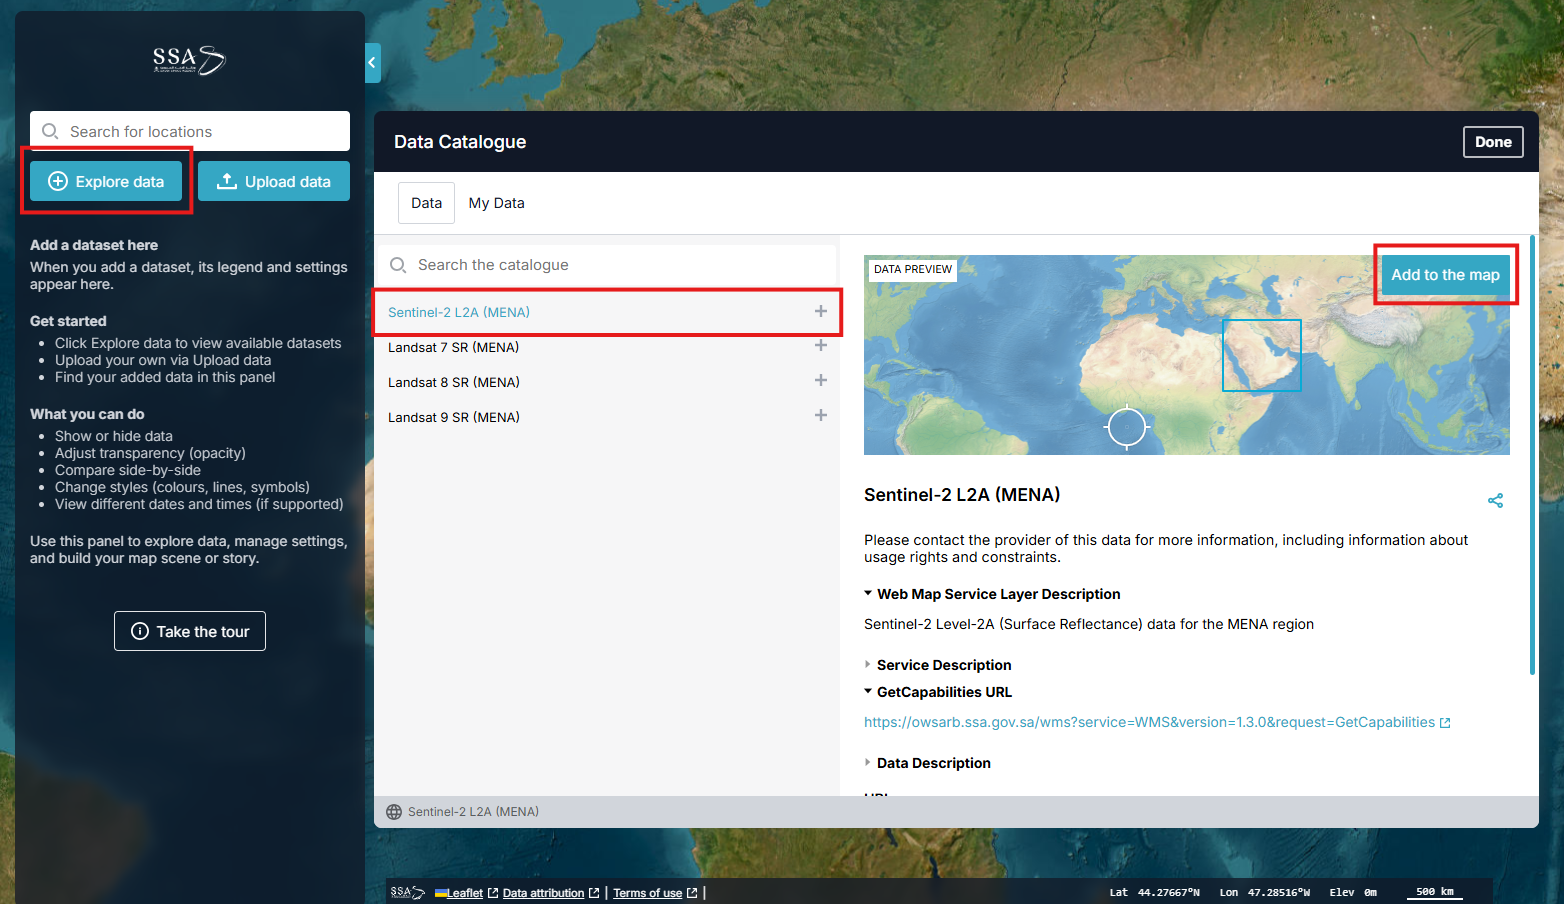
Click Explore data (see image below).
In the data catalogue, navigate through the folders to find the dataset that you want to access (e.g., Sentinel-2) then add it to the map.Select the dataset to see a preview of that data and description.
To view your selected dataset on the map, click the Add to the map button.
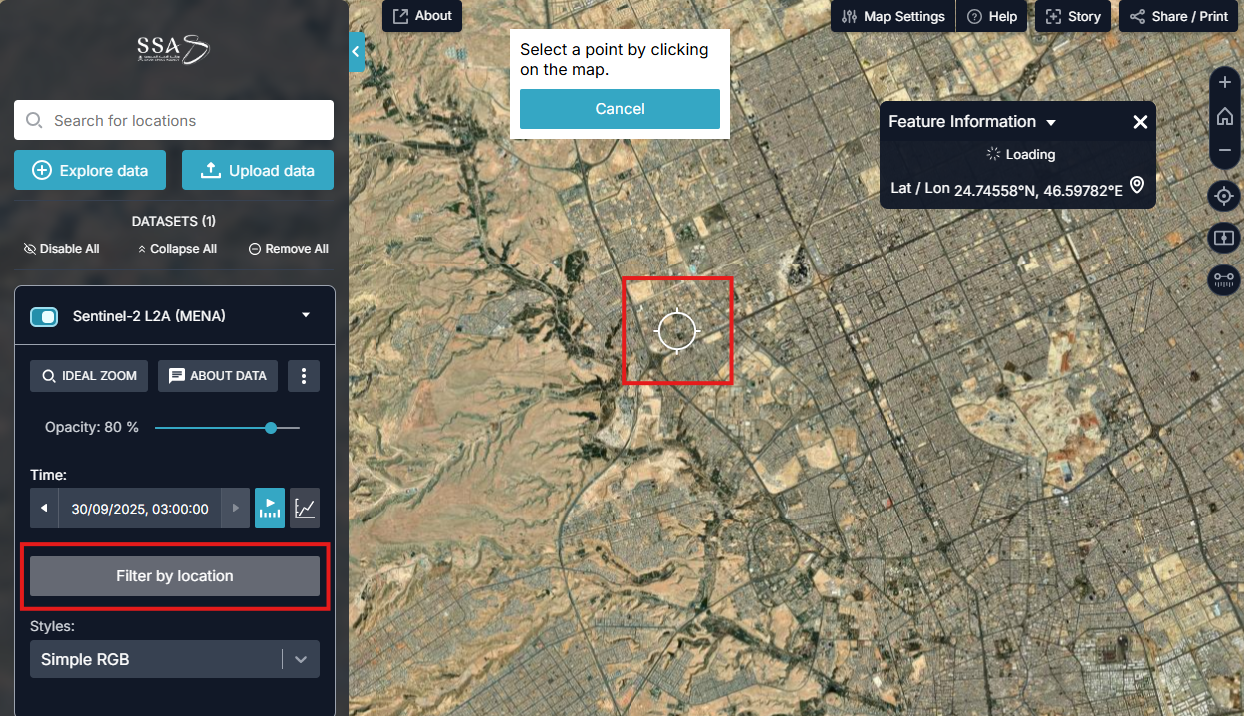
Filter by location
After adding the data to the map, you can use the ‘Filter by location’ tool. This is useful to understand where the data is available and for what times. You may find that no data exists at all for a particular time and location.
Filter by location will show the most recent data that is available for a given location.
In the left sidebar, click Filter by location for the dataset you have added to the map.
Click a location on the map then wait for it to load.
Data should now be overlaid on that location. The left sidebar will indicate that the filter has been applied.
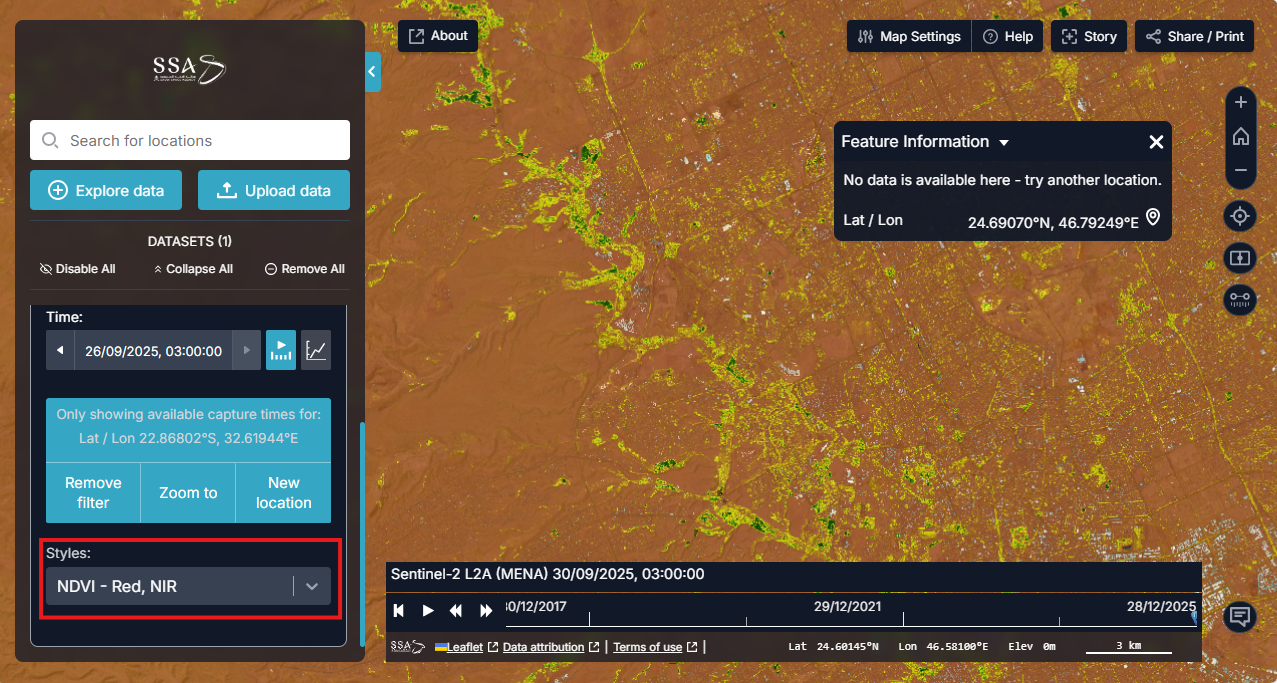
Next, you can either Remove filter or New location.
Share a URL and save your map
After creating a map by adding datasets, adjusting the map settings, and zooming in to the wanted location, you can share the map with others, or save it for later.
Click Share/Print on the top right.
Click Copy to copy this custom URL to your clipboard.
Anyone opening this URL will see the map with the same configurations and viewing location.

Switch syles (bands and layers)
Most datasets contain multiple ‘bands’ or ‘layers’ of data that reveal different features of the data. You can switch between these using the Styles dorpdown in the left sidebar.
For example, the Sentinel-2 dataset can be switched to the ‘Simple RGB’, which is a classic image visualization that resembles what the human eye see. More complex bands or ‘styles’ can be switched to, such as ‘Vegetation red edge’ or ‘Near infrared’ or even ‘NDVI’ for vegetaion health index.
Compare side-by-side
There is a Compare feature that lets you view two different map configurations side-by-side. This allows you to compare two different datasets or the same dataset at two different times.
In the left sidebar, click the ⋮ button (‘Show more actions’) on a dataset that you have added to the map > click Compare
The map will now be split into two halves. In the sidebar, the dataset’s card will be split into two separate cards: one labelled ‘Left’ and the other ‘Right’.
You can drag the divider to easily see the difference between the two sides.
If one of the sides is not showing the data, make sure to use the Filter by location again so that both sides showcase datasets in the same location
You can configure each side of the map independently.
Each dataset can be assigned to either the Left or Right side or Both by selecting the relevant option in the left sidebar.
To compare two different datasets side-by-side: add an additional dataset to the map > assign it to the right or left side > remove the existing dataset that was assigned to that side.

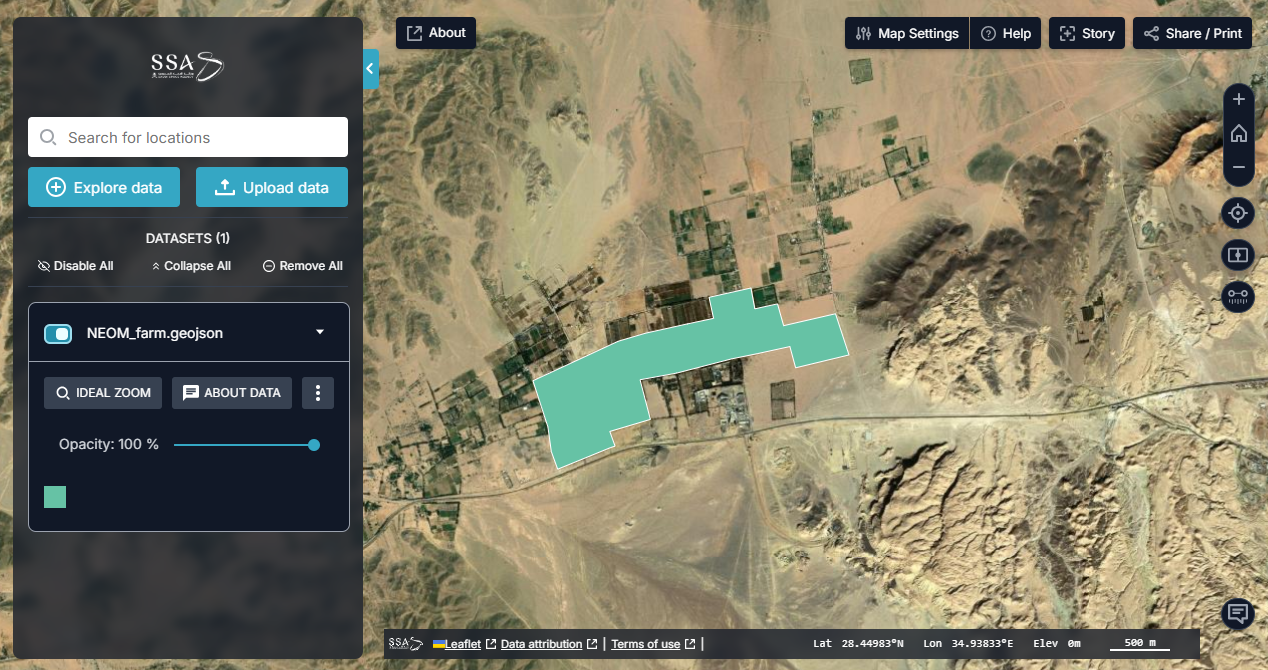
Upload Data to the Map
There are two ways to load your data:
Drag your data file onto the map view. The format of the data file will be auto-detected.
Select Upload Data in the left panel. This will launch the data catalogue. Select the My Data tab at the top of the modal window and follow the provided instructions. You can manually add data from your local computer by clicking Add Local Data. Another option is to upload a Map Web Service from the Web by clicking on Add Web Data and provide the map URL from the web. Spreadsheets must be saved as CSV (comma-separated values). Other standard spatial data types such as GeoJSON and KML are also supported.